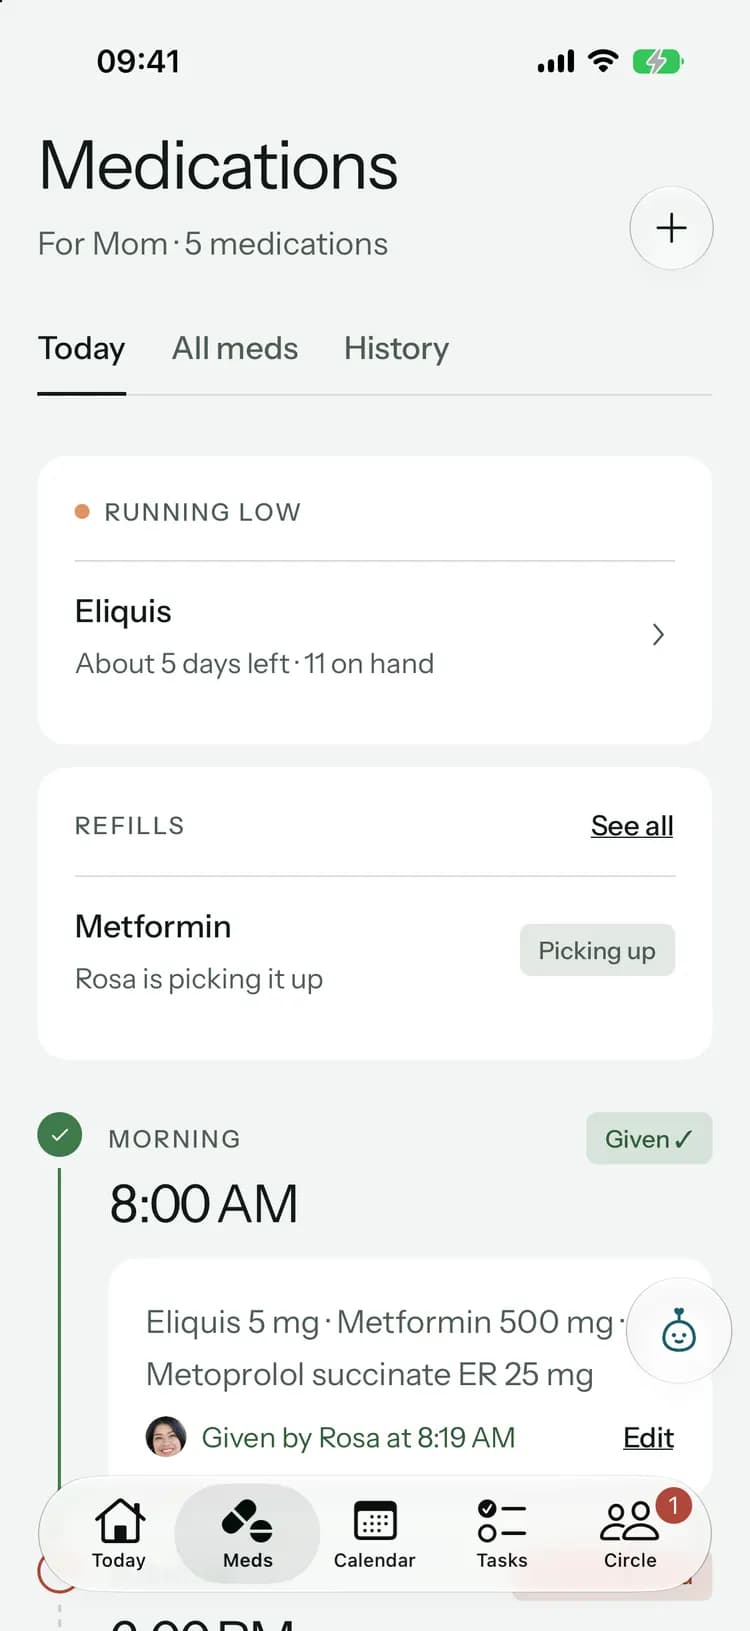
Health
See how they’re really doing.
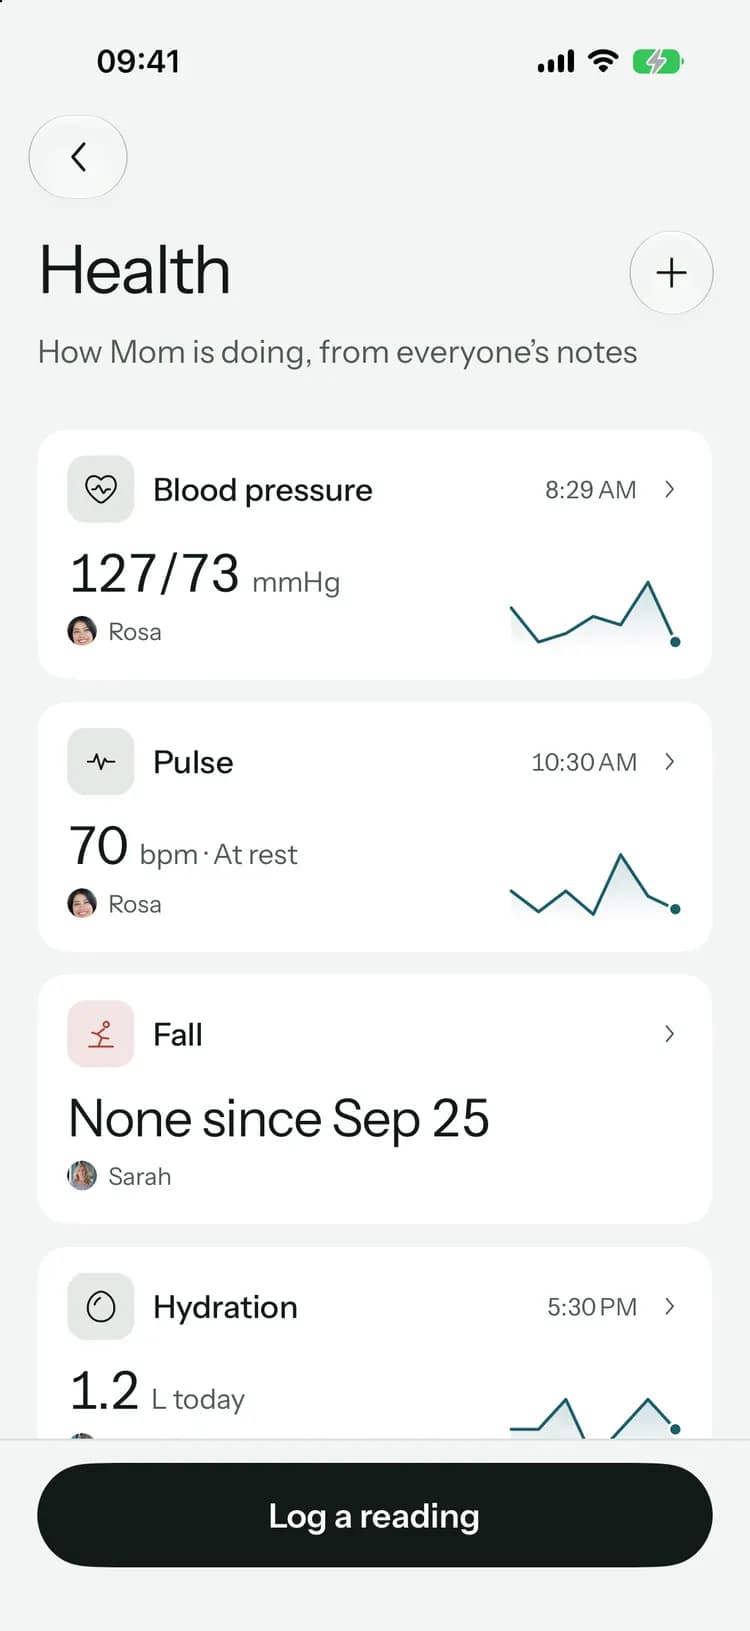
Blood pressure, pulse, blood sugar, temperature, oxygen, weight, pain, sleep, appetite, water and falls, logged in a few taps by whoever is there. Everyone sees the trend against their usual range.
Log it in seconds.
- 1
Log a reading
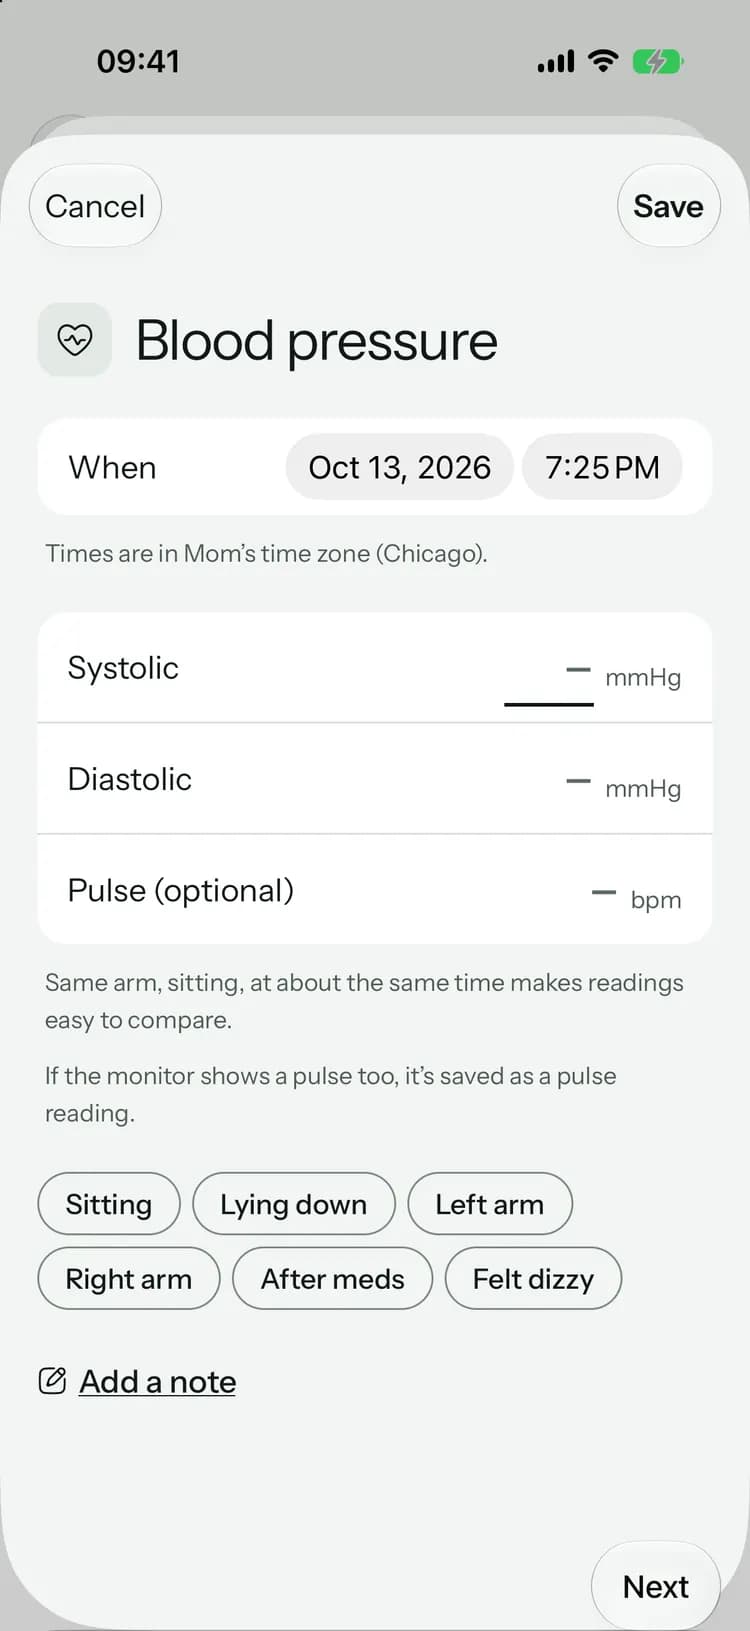
Enter the numbers and tap what fits, like sitting, left arm or after meds, so readings are easy to compare.
- 2
Or how they’re feeling
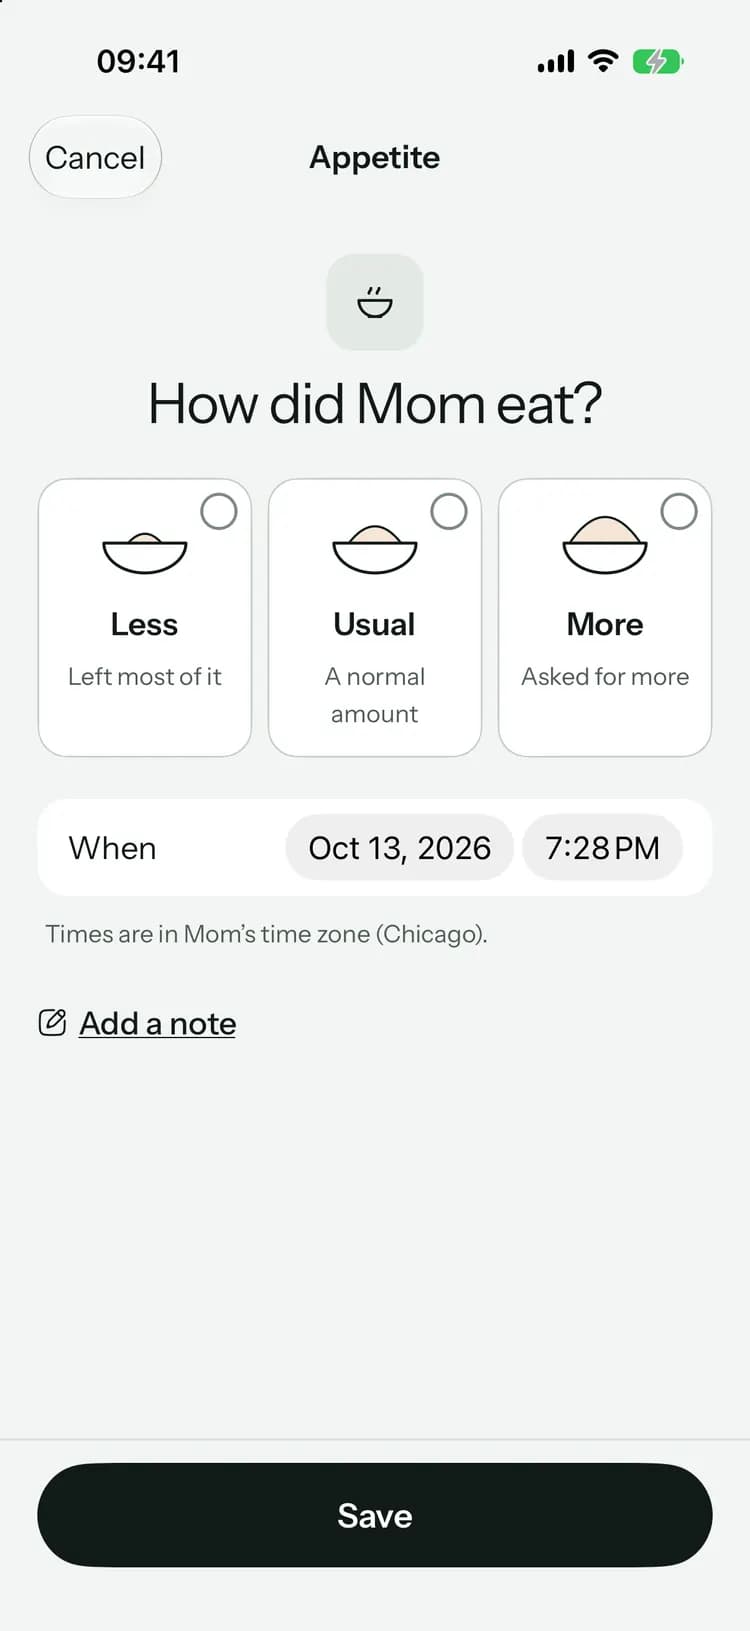
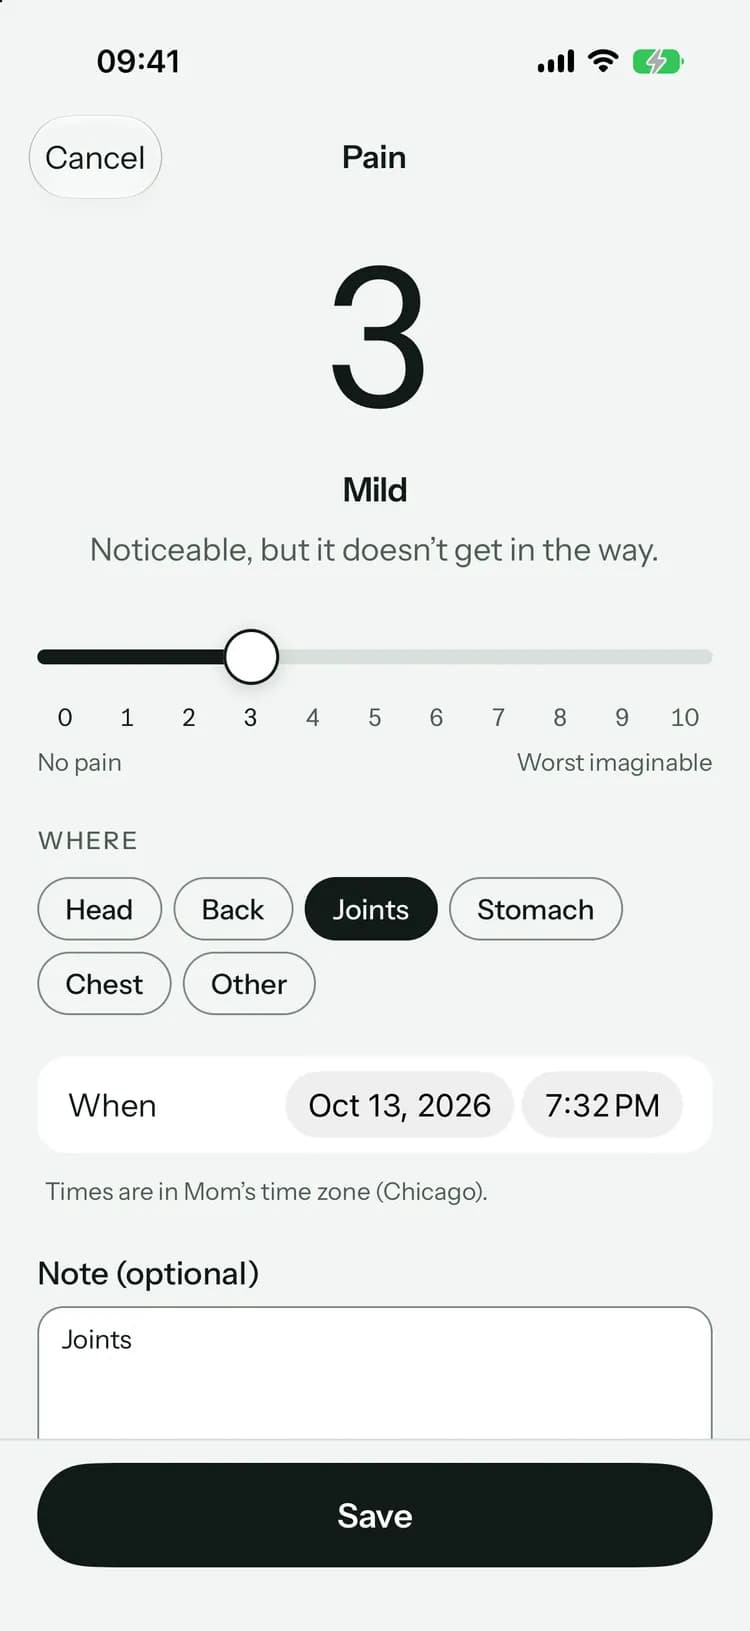
Pain from 0 to 10 and where it hurts. How they ate, how long they slept. A tap or two each.
- 3
See the trend
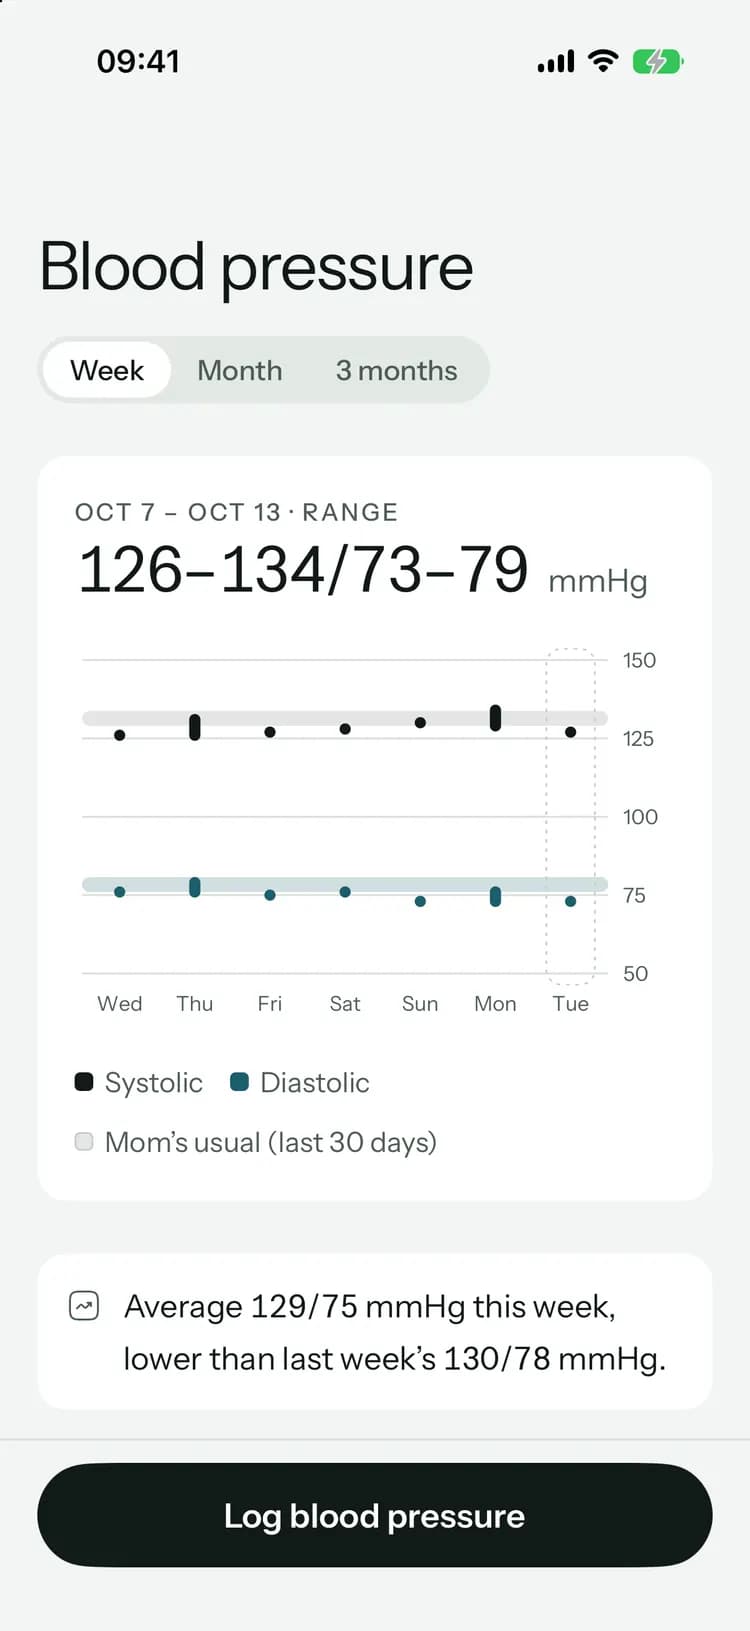
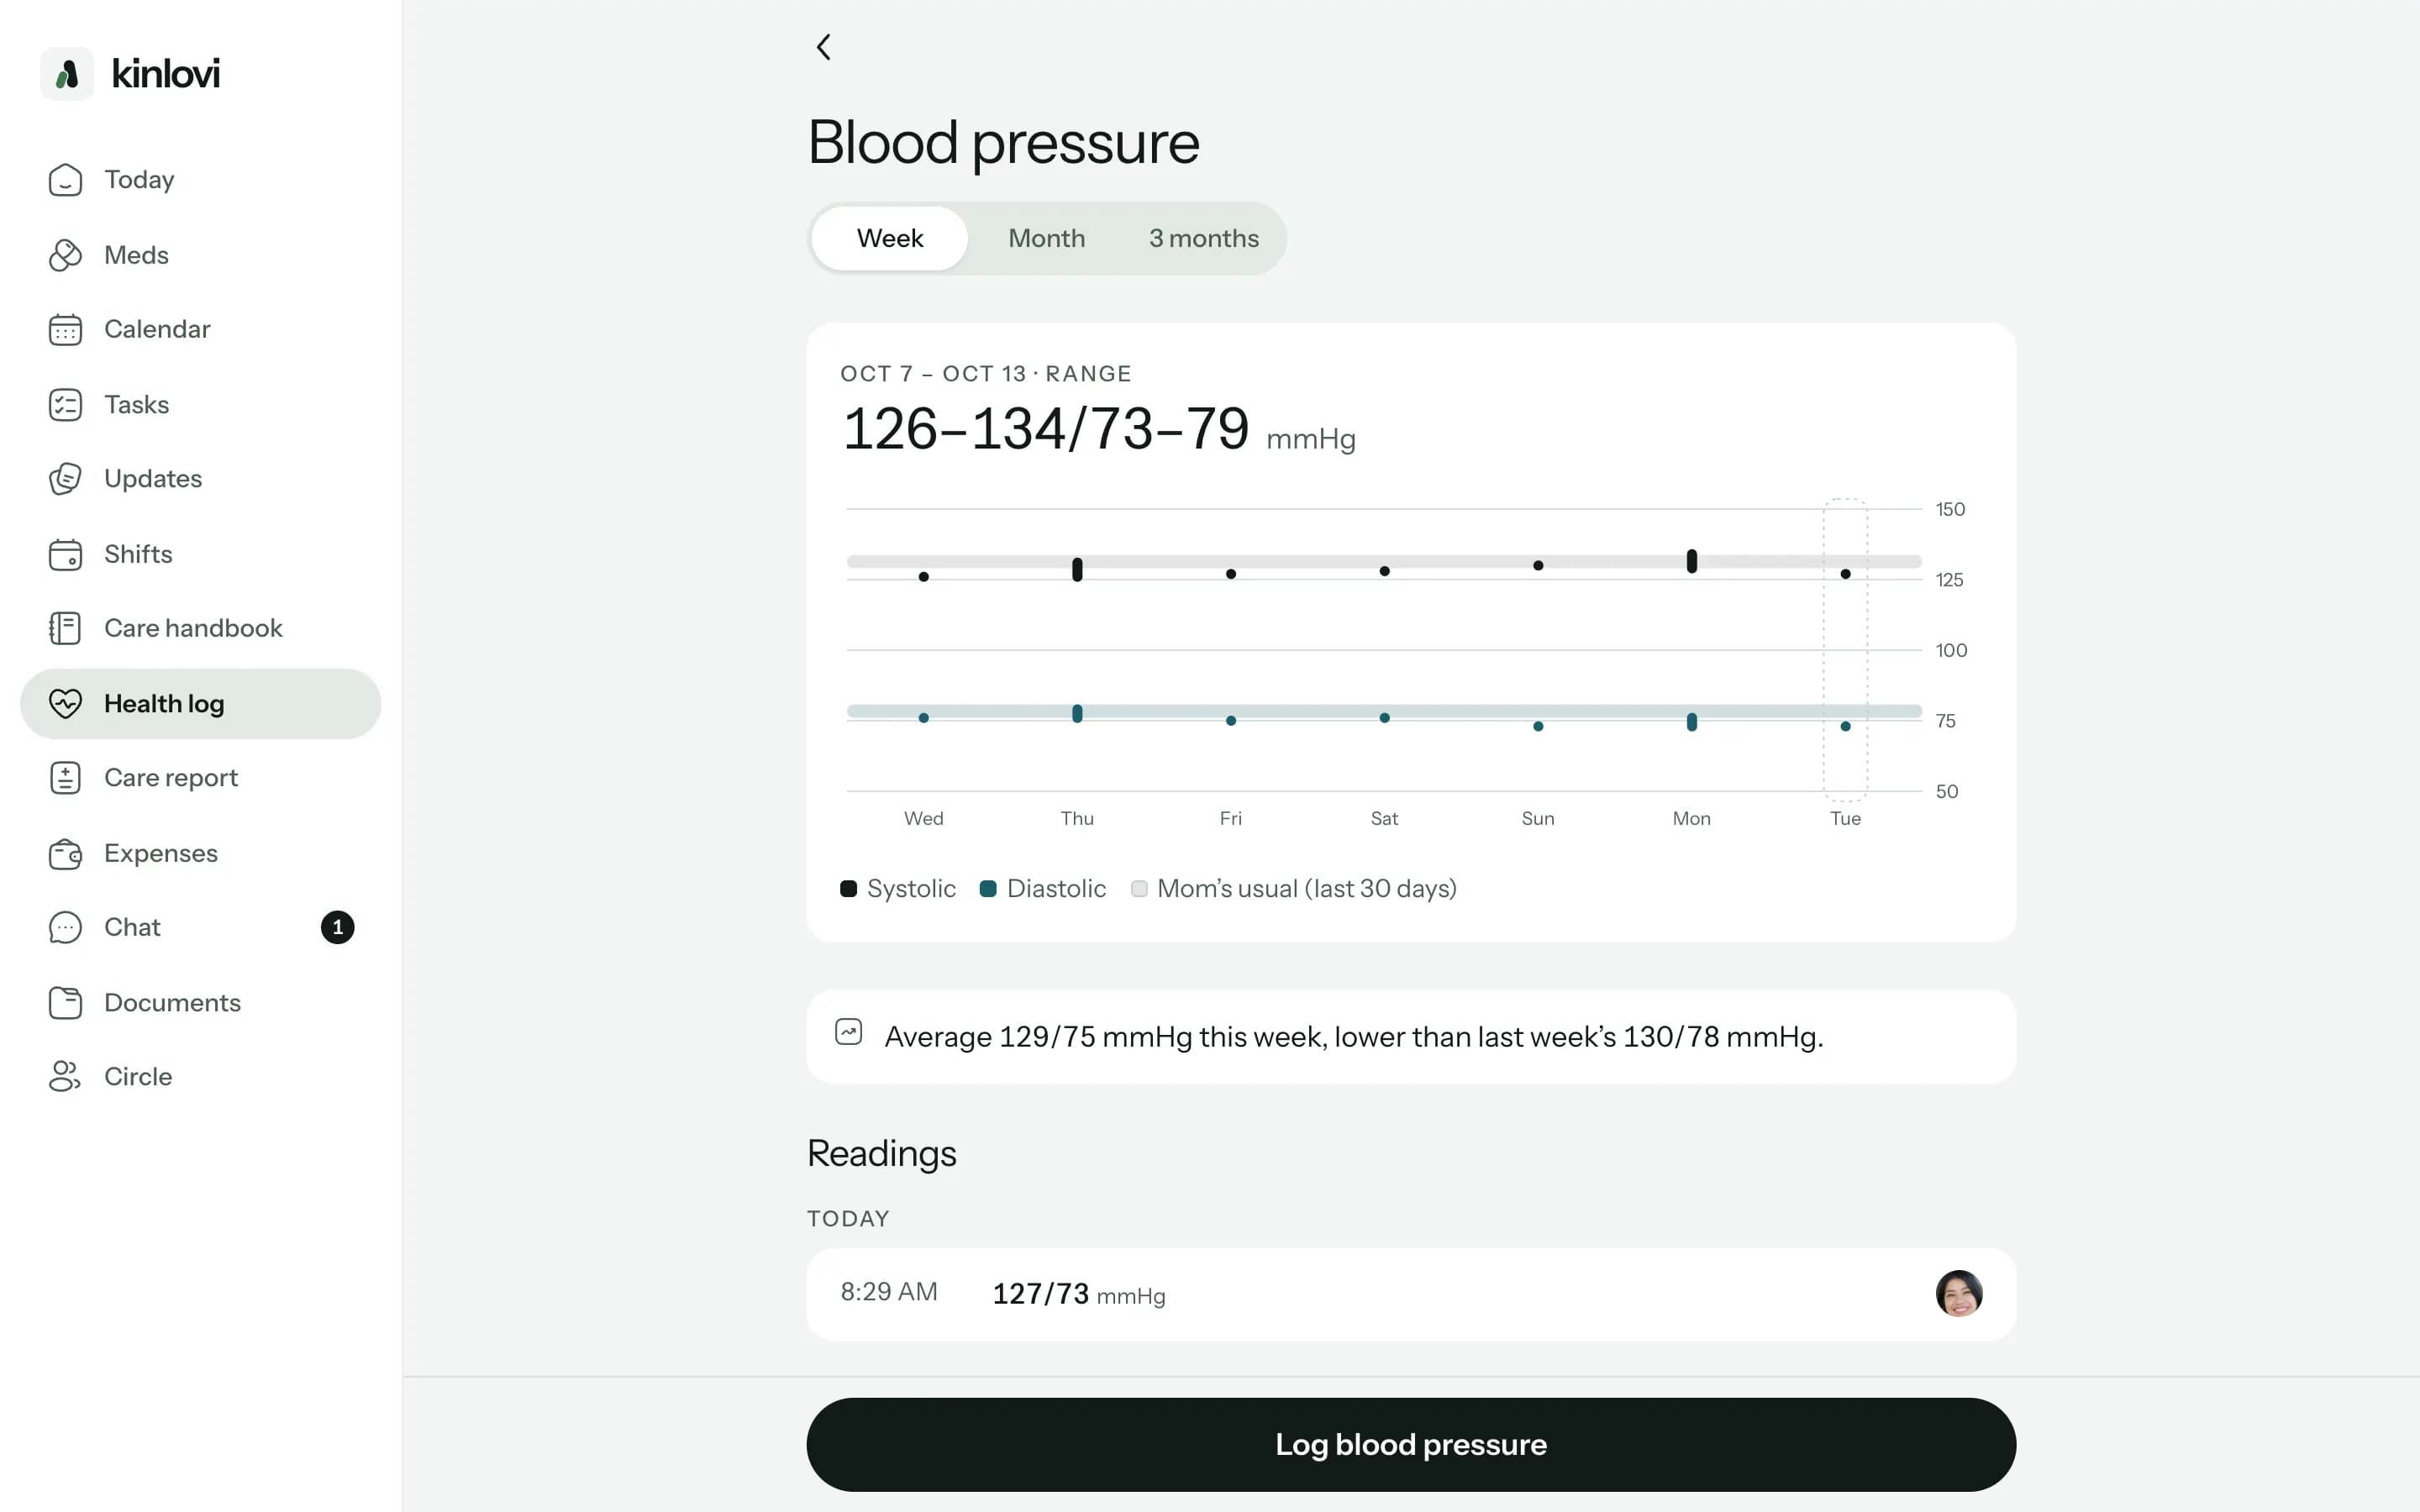
Every measure on a chart for a week, a month or three months, with their usual range shaded in.
Eleven things worth keeping track of.
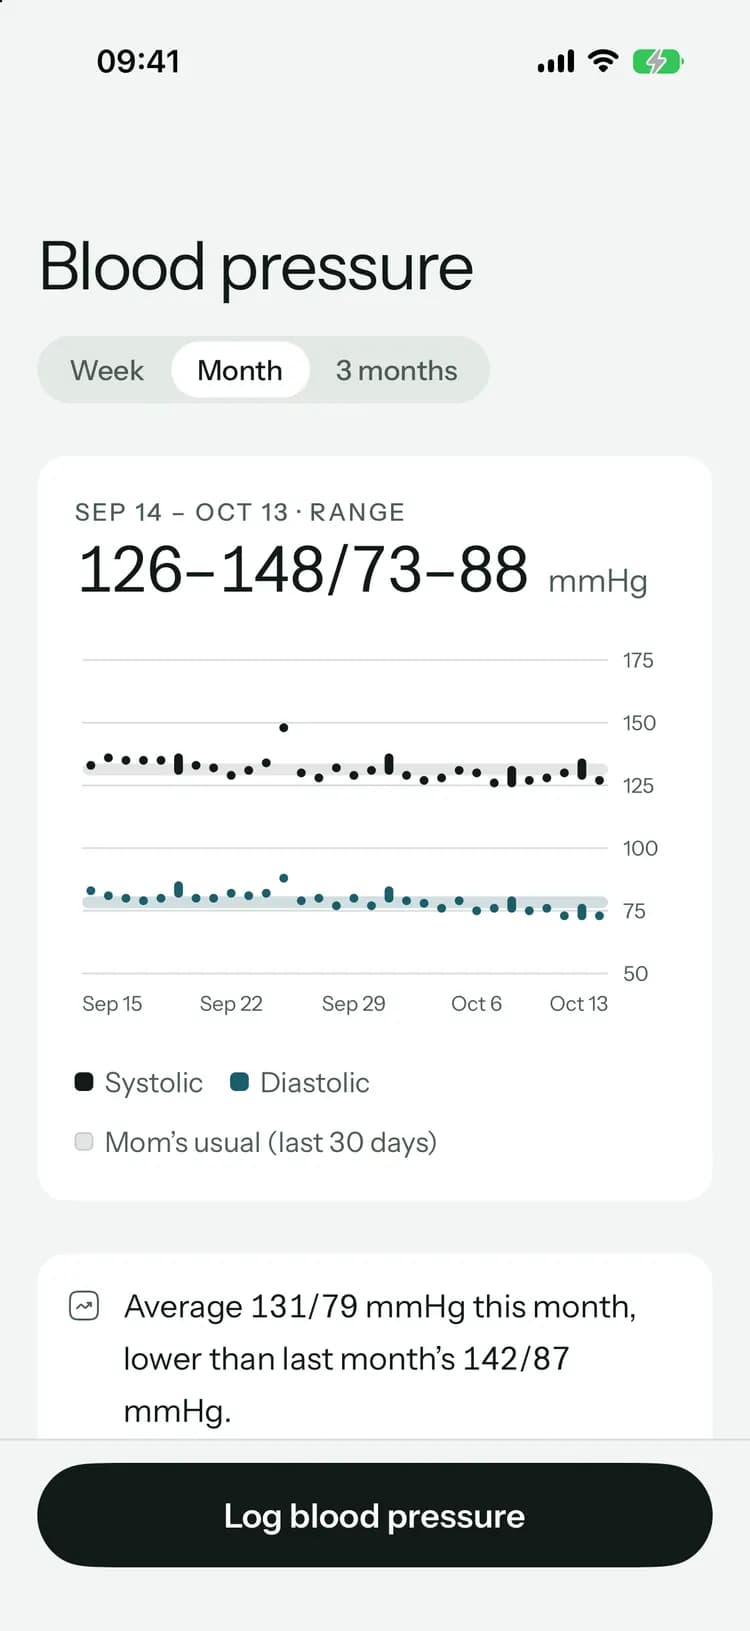
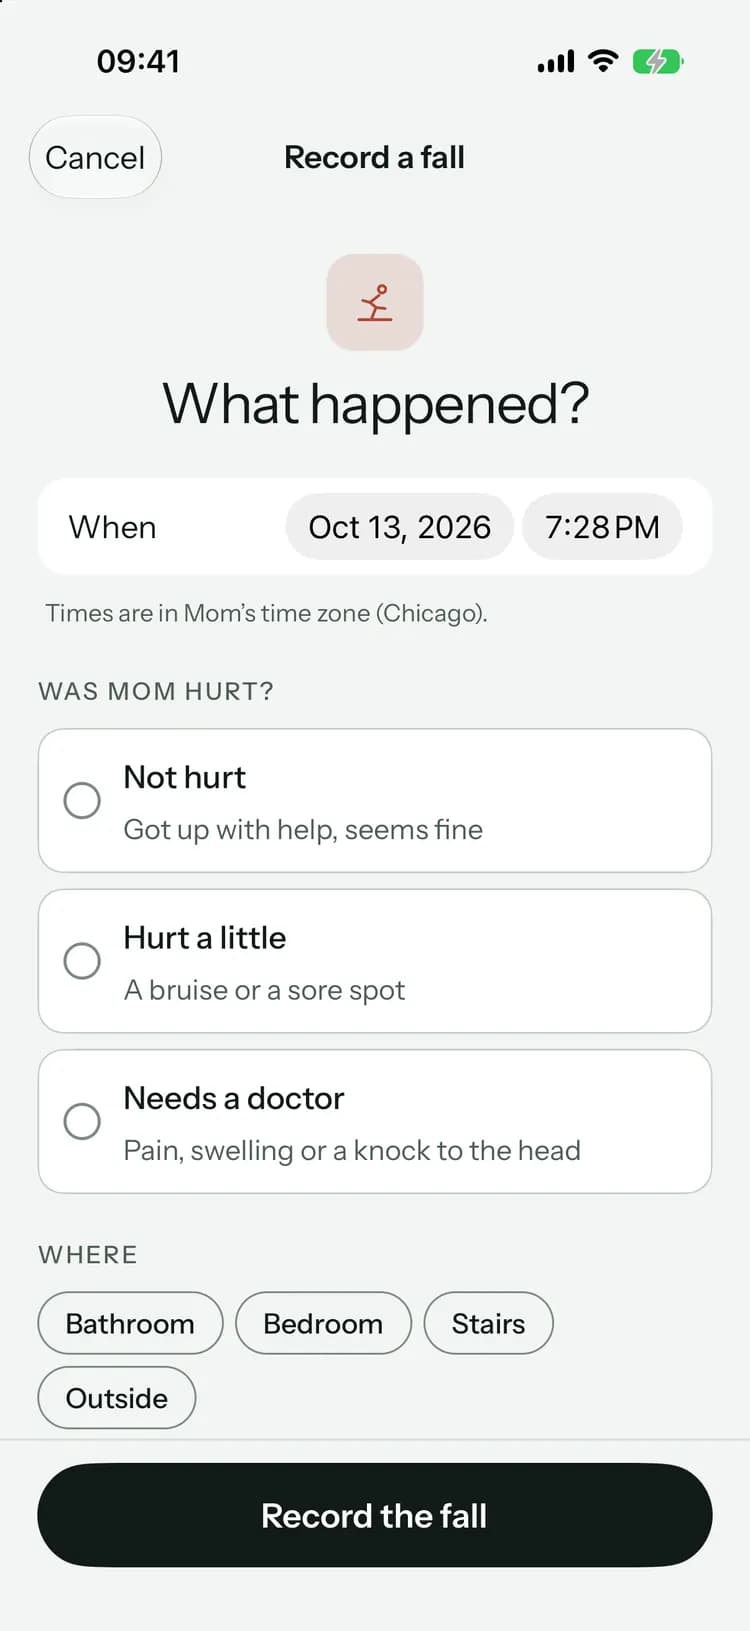
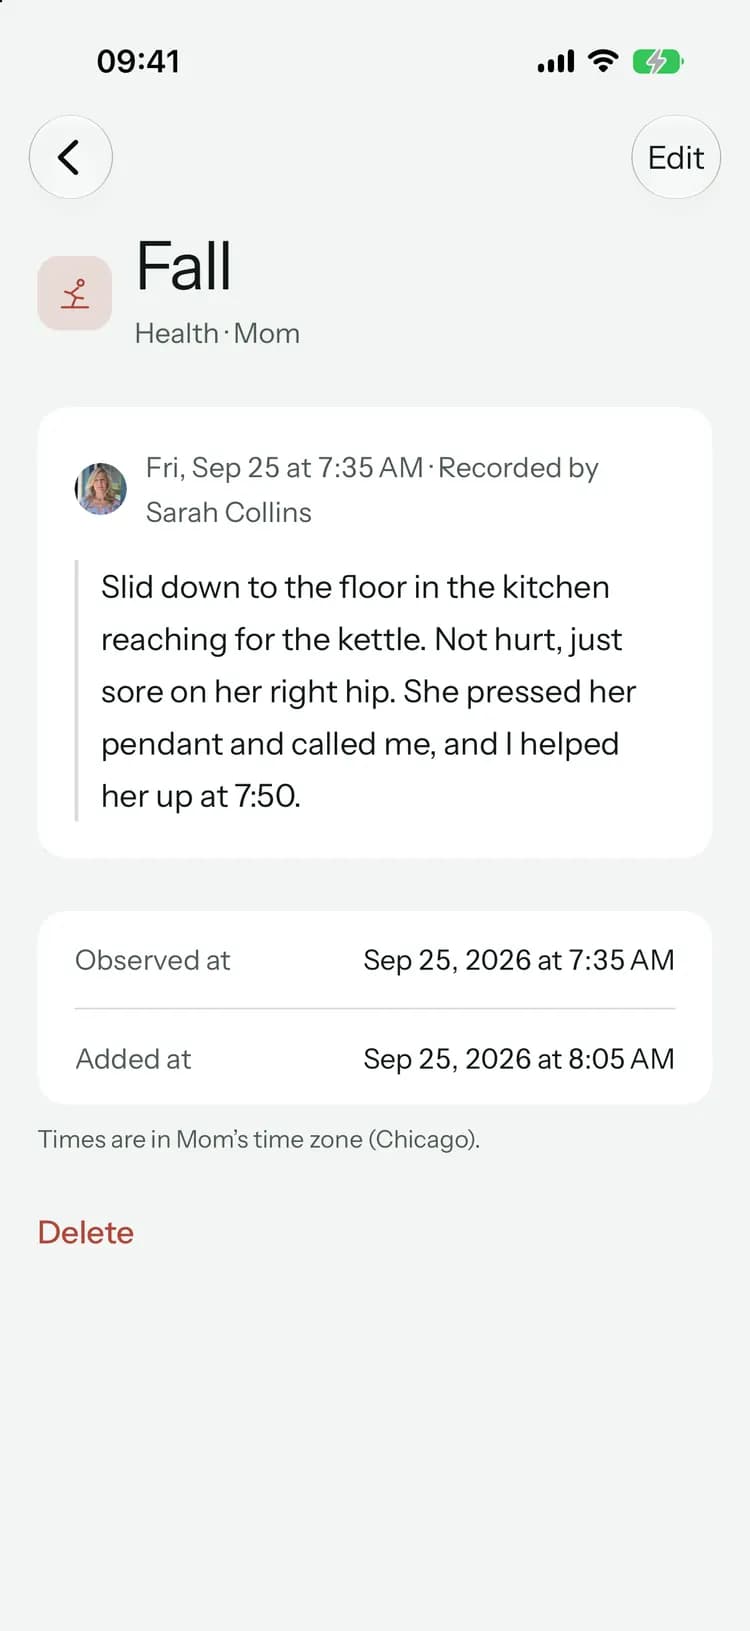
Their usual range comes from their own last 30 days. A sentence says how this month compares with the last.
Their usual range comes from their own last 30 days. A sentence says how this month compares with the last.
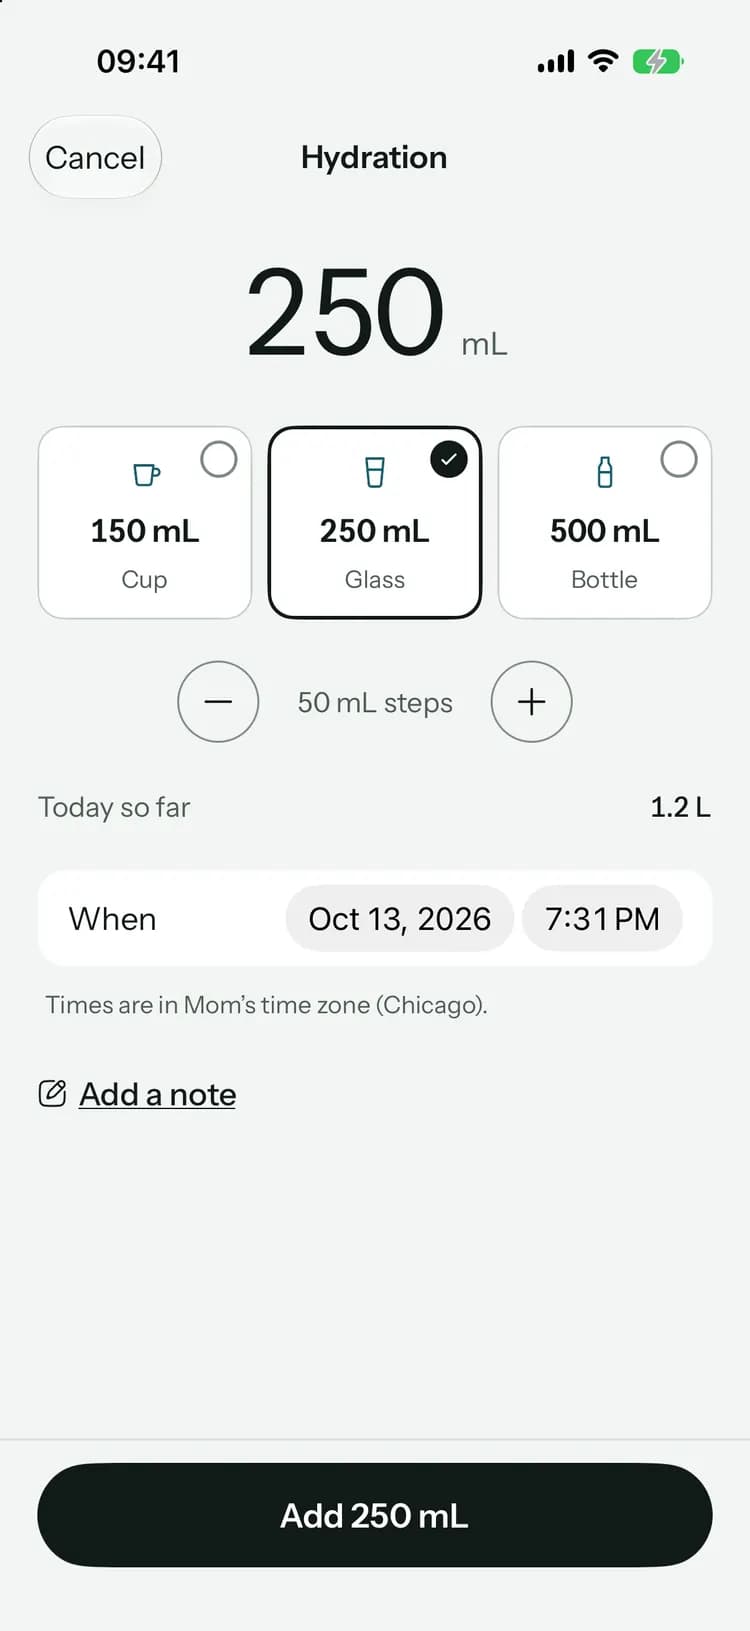
Tap a cup, a glass or a bottle, and the day’s total adds up as you go.
When and where it happened, and whether they were hurt. The rest of the circle gets a notification, so nobody hears about it days later.
Each entry keeps the time it was observed and the person who recorded it.
The chart, on a big screen.
Made for the person who was there.
Anyone can log
Family and paid caregivers can both record observations, so whoever was there writes it down.At the right time
Record when it was observed, not when you got around to typing it, in their time zone.A note when it helps
Add a few words to any entry, like where the pain was or what happened before a fall.In everyone’s language
Each person picks their own app language from 14, right to left included.
On every plan
All eleven kinds of observation, and their trends, are included on every plan, Free too.
Common questions
Something else on your mind? Visit the help center

See what’s changing before the next visit.
Free to start, on iPhone, Android and the web. Everyone you invite joins free.
Launching soon. Tell me when it’s live